The same method as our stories, pointed at your business: find the few numbers that matter, show where they came from, and explain them so anyone gets it. For investors, a board, your team or your customers.
A one-page infographic and an interactive receipt, like the one below, built from your own books. Every number shows where it came from. Use it in a deck, an email, a board pack or on your website.
Shown on Starbucks' public annual report. Yours would show your own figures, from your own books.
Where the money came from, where it went, what changed.
The quarter in one page, with the numbers behind it.
Show the whole team how the business really makes money.
Explain your pricing or your value with real figures.
A 60 to 90 second explainer in the same style as our long-forms: clay scenes, the numbers on screen with their source, and a clear voice. You get the video, captions and the Snapshot that goes with it.
Where your cash lands over the next quarter, week by week, from a few inputs. Excel.
Ready. Store opening soon: email to get it now.Turn your P&L into a receipt: where every $5 a customer pays you really goes.
In the worksThe guide to the few pages of an annual report that matter, and the numbers to pull.
In the worksEvery order, invoice and payment in your books is a signal. The Business Review turns them into one monthly read of your business, and the three things worth doing next. Built for owner-run businesses on QuickBooks Online. Your data never leaves your own Microsoft account.
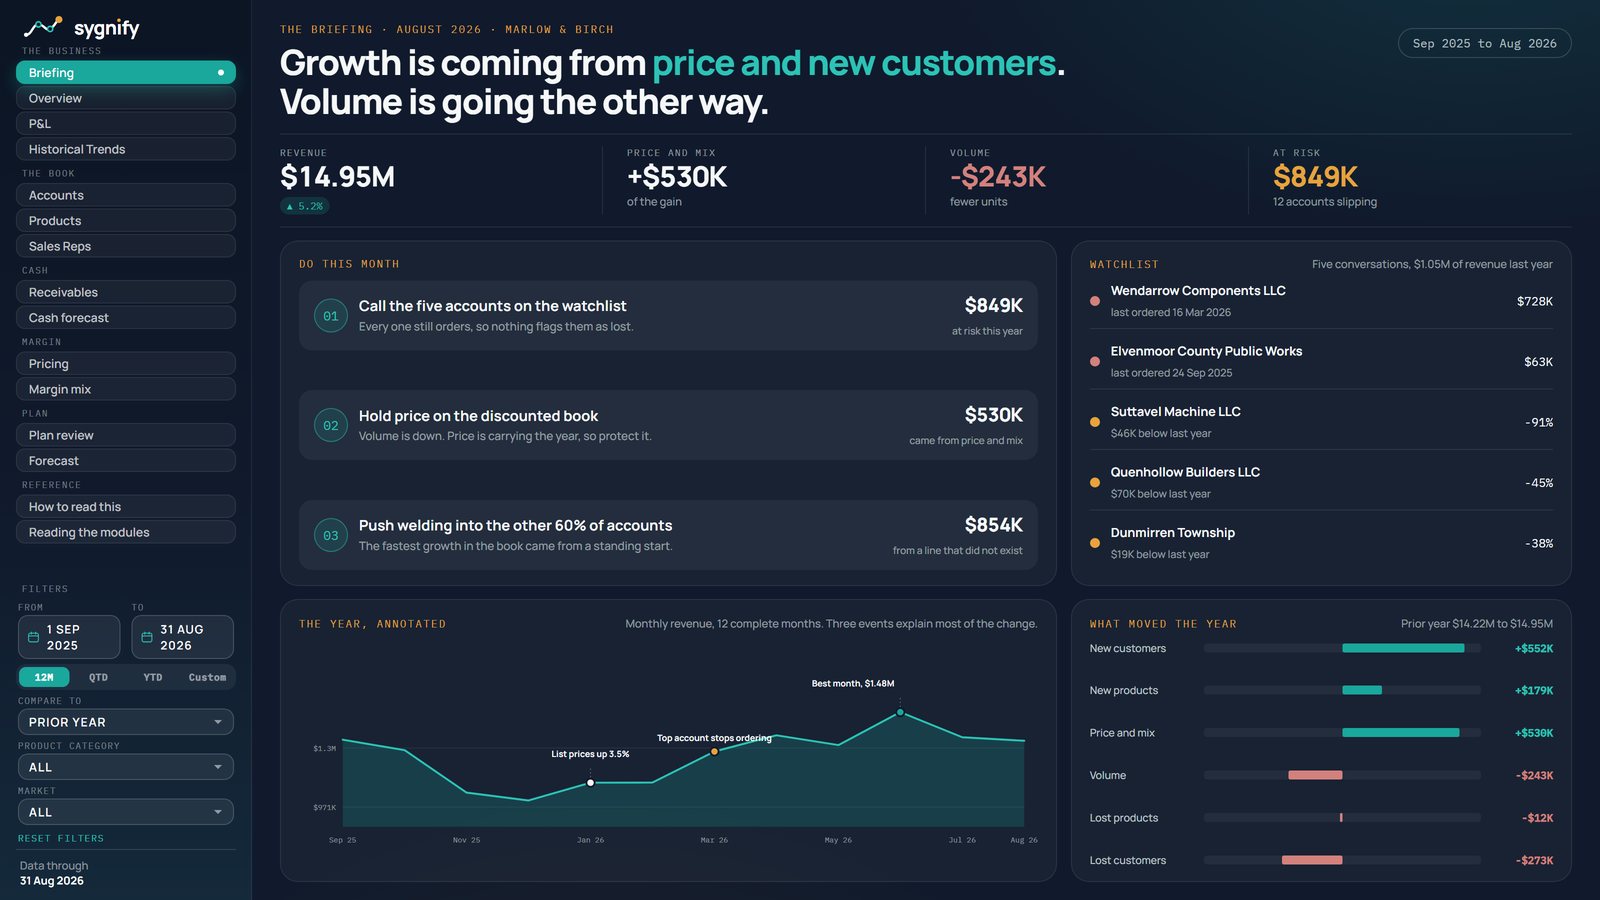
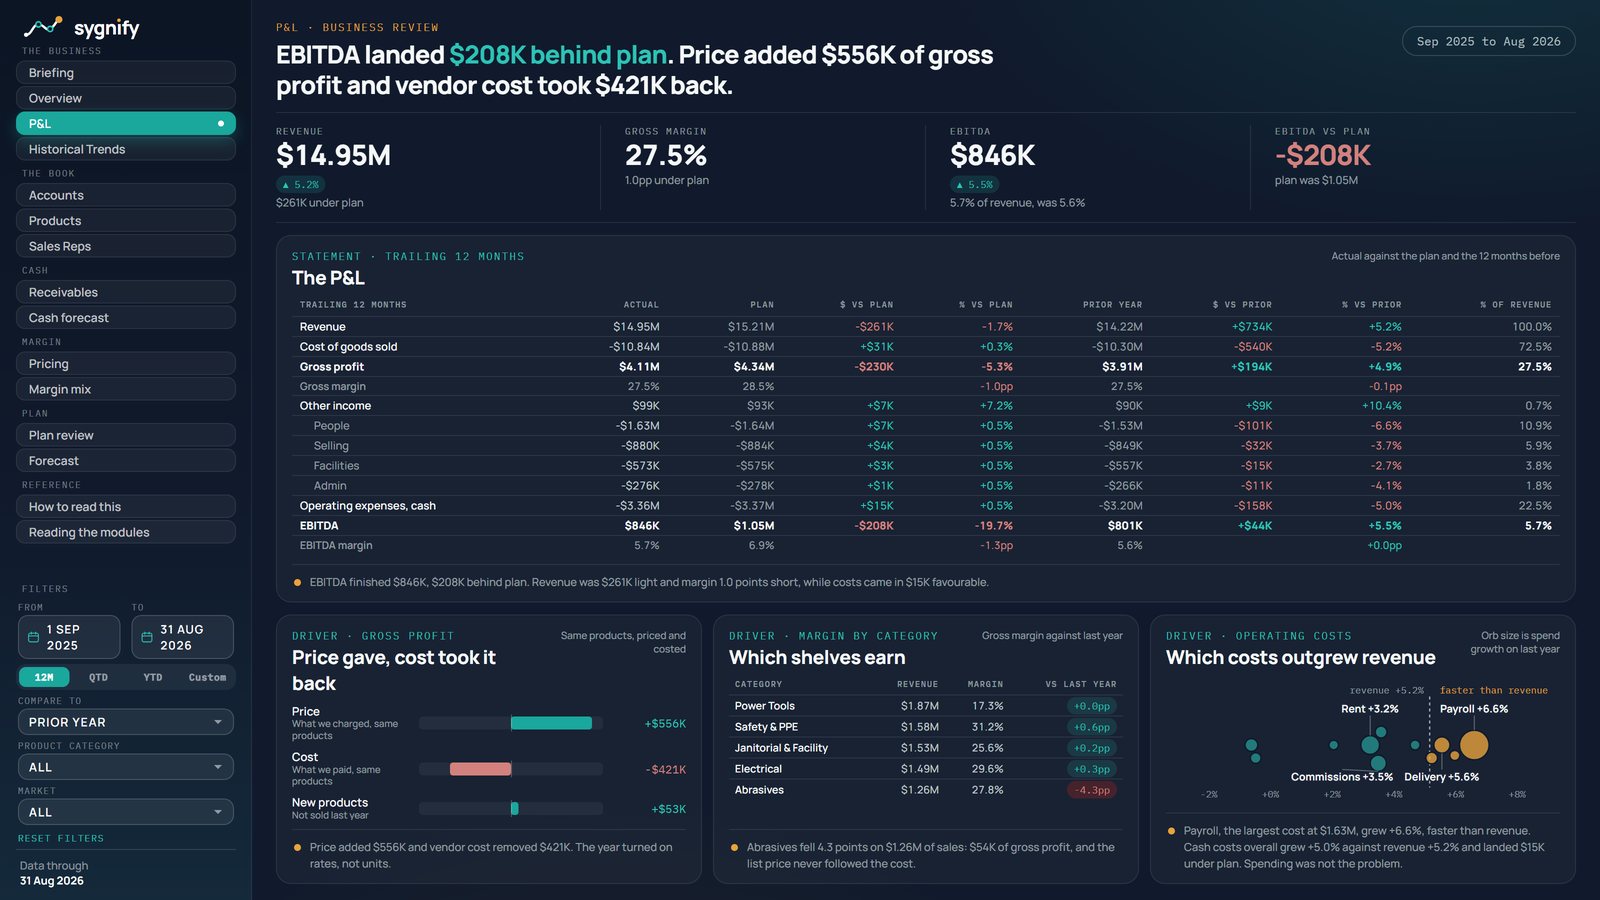
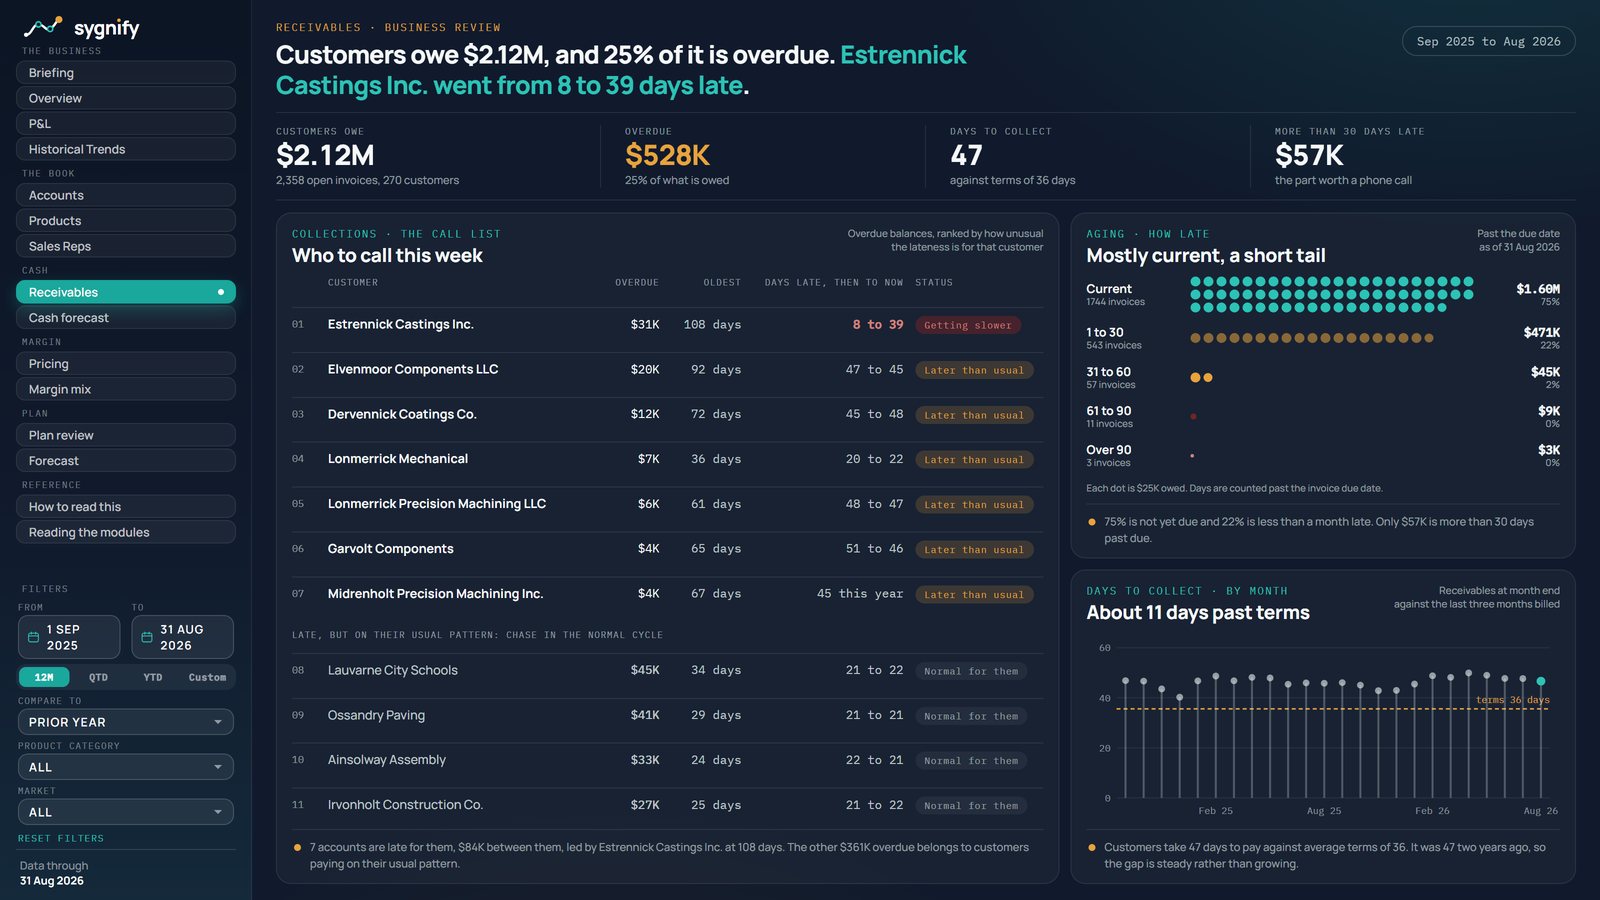
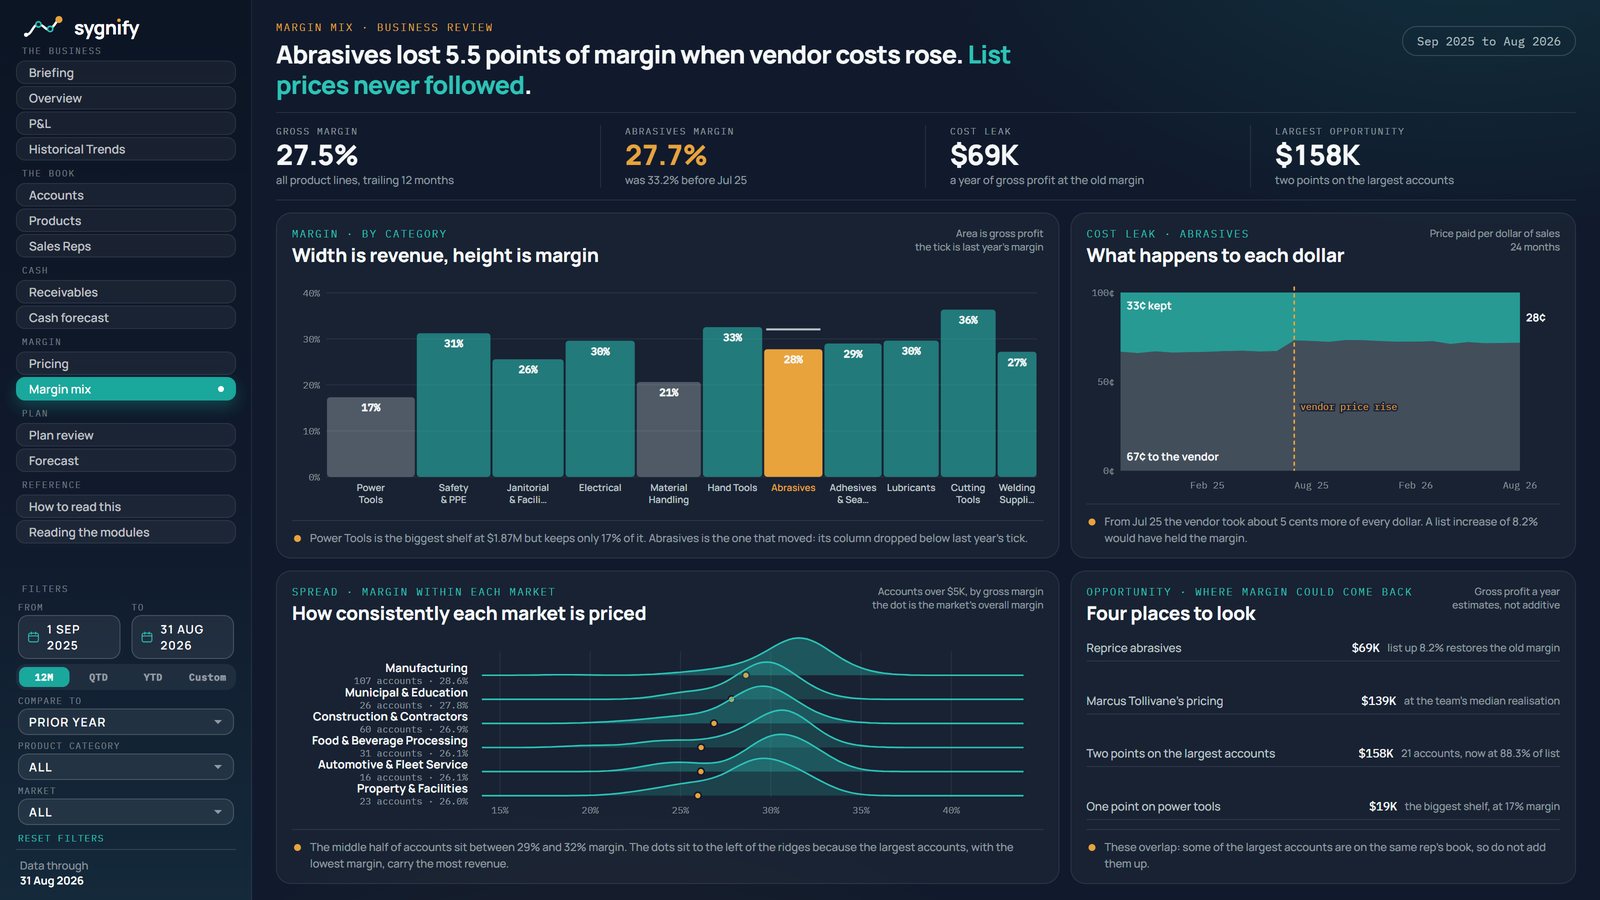
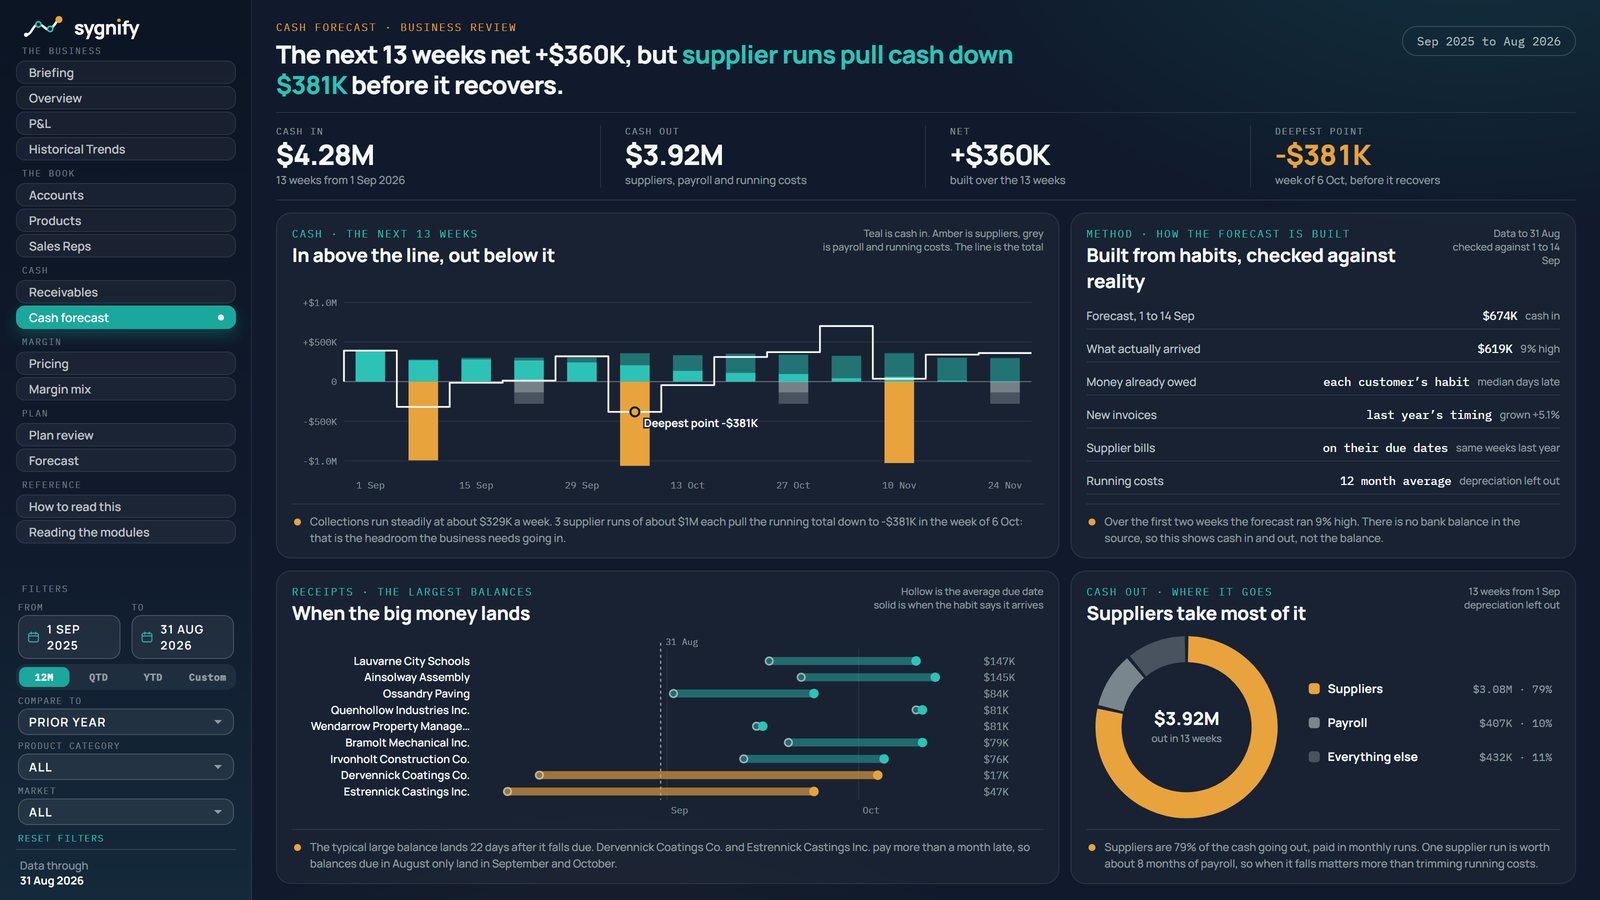
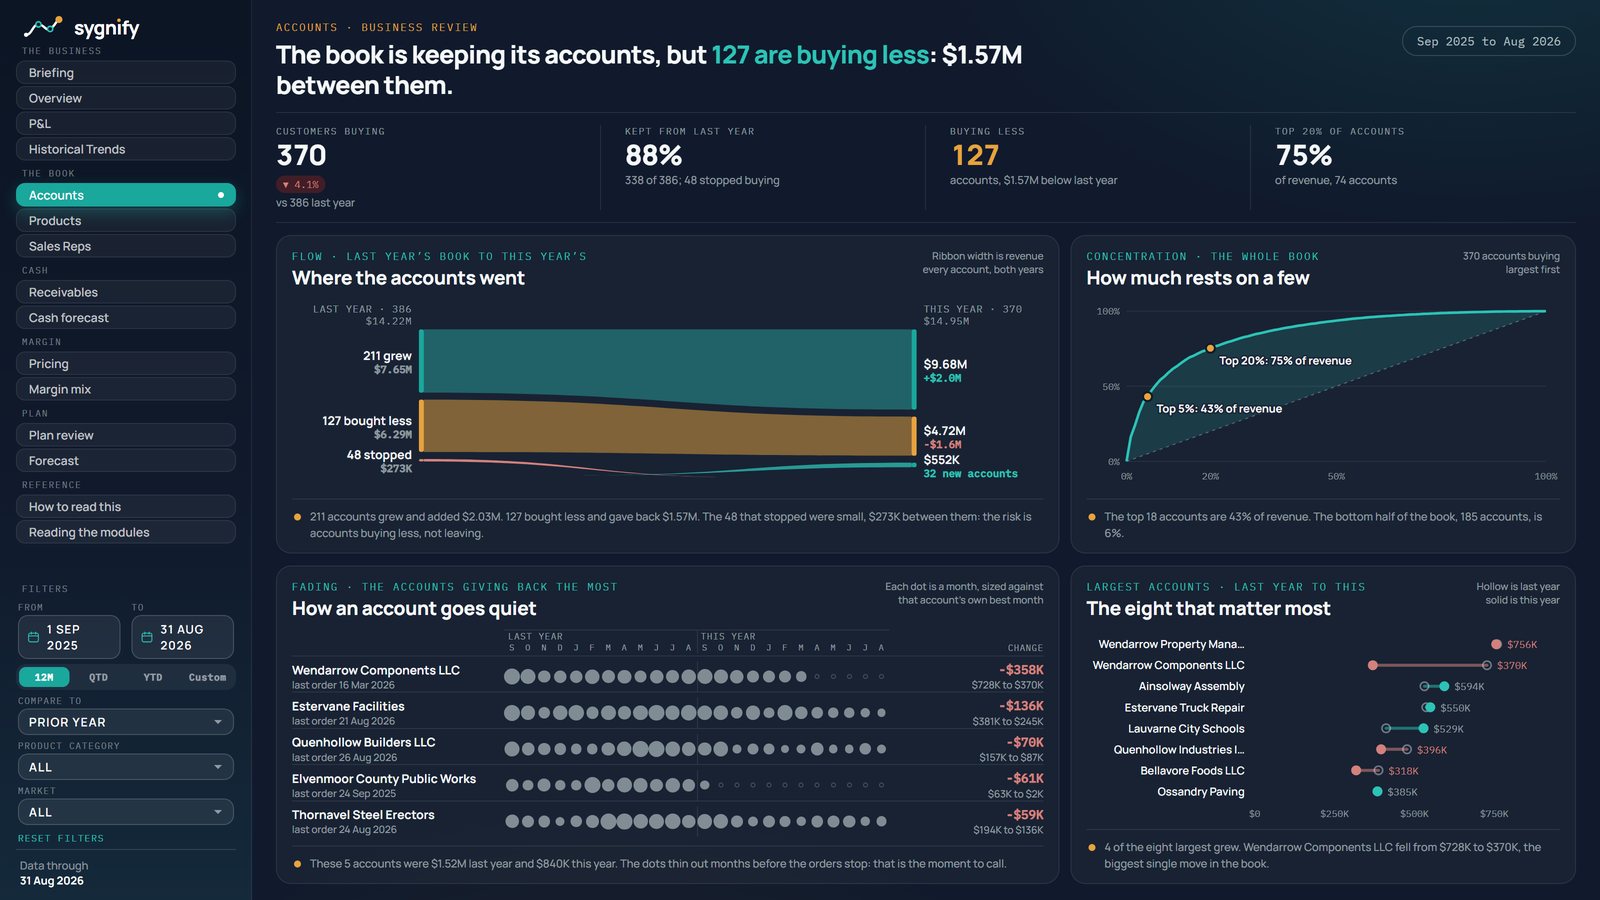
Shown on Marlow & Birch, a fictional distributor with three years of data. The reports are real.
Setup is $5,000 fixed, plus $1,500 per module, then monthly. Month to month after setup, with 30 days' notice. The first three clients pay half the setup in exchange for a case study.
Your Business Review, kept running and refreshed every morning.
A person reads it with you: written Briefing, 30 minute call, one module.
A standing analyst: Board and Lender pack, Plan module, 4 hours of analysis.
Pricing and margin, customer and product profitability, cash and receivables, next year's plan.
New pages for your questions, other systems, AI tools built on your data.
Your Business Review as a print-ready PDF for a board, bank or investor. Included in Partner.
A half or full day on finding the few numbers that matter in your own reports, checking them, and explaining them so a room remembers. Built around your business, not a textbook.